Overview
Utilization metrics give proactive and reactive indicators to the health and performance of cluster resources. The graphs used for displaying metrics support a common set of interactions.
- You can adjust the time range slider on the bottom of the graph
- View the raw data by clicking the 📄 button
- Restore the graph to its default view by clicking the 🔄 button
- Download an image of the graph's current view by clicking the ⬇️ button
Load balancer metrics
You may view the HTTP response codes to publicly hosted services running in a cluster by clicking the Load balancer metrics button in a cluster. Up to the past 30 days of HTTP response codes can be viewed on the graphs.
To learn more about interpreting these graphs, please review our article on determining the cause of HTTP response codes.

Node and container metrics
You may view the CPU, Remaining credits, Memory, and Storage utilization of a node and containers running on the machine by clicking the View metrics button for each node in a cluster.
📘 CPU credits for burstable nodes
Small and Medium nodes are burstable tier virtual machines. As such, Small and Medium nodes can temporarily use more than 100% CPU capacity for a temporary amount of time.


Database metrics
Database server metrics can be accessed by clicking the "View Metrics" button for the respective server.
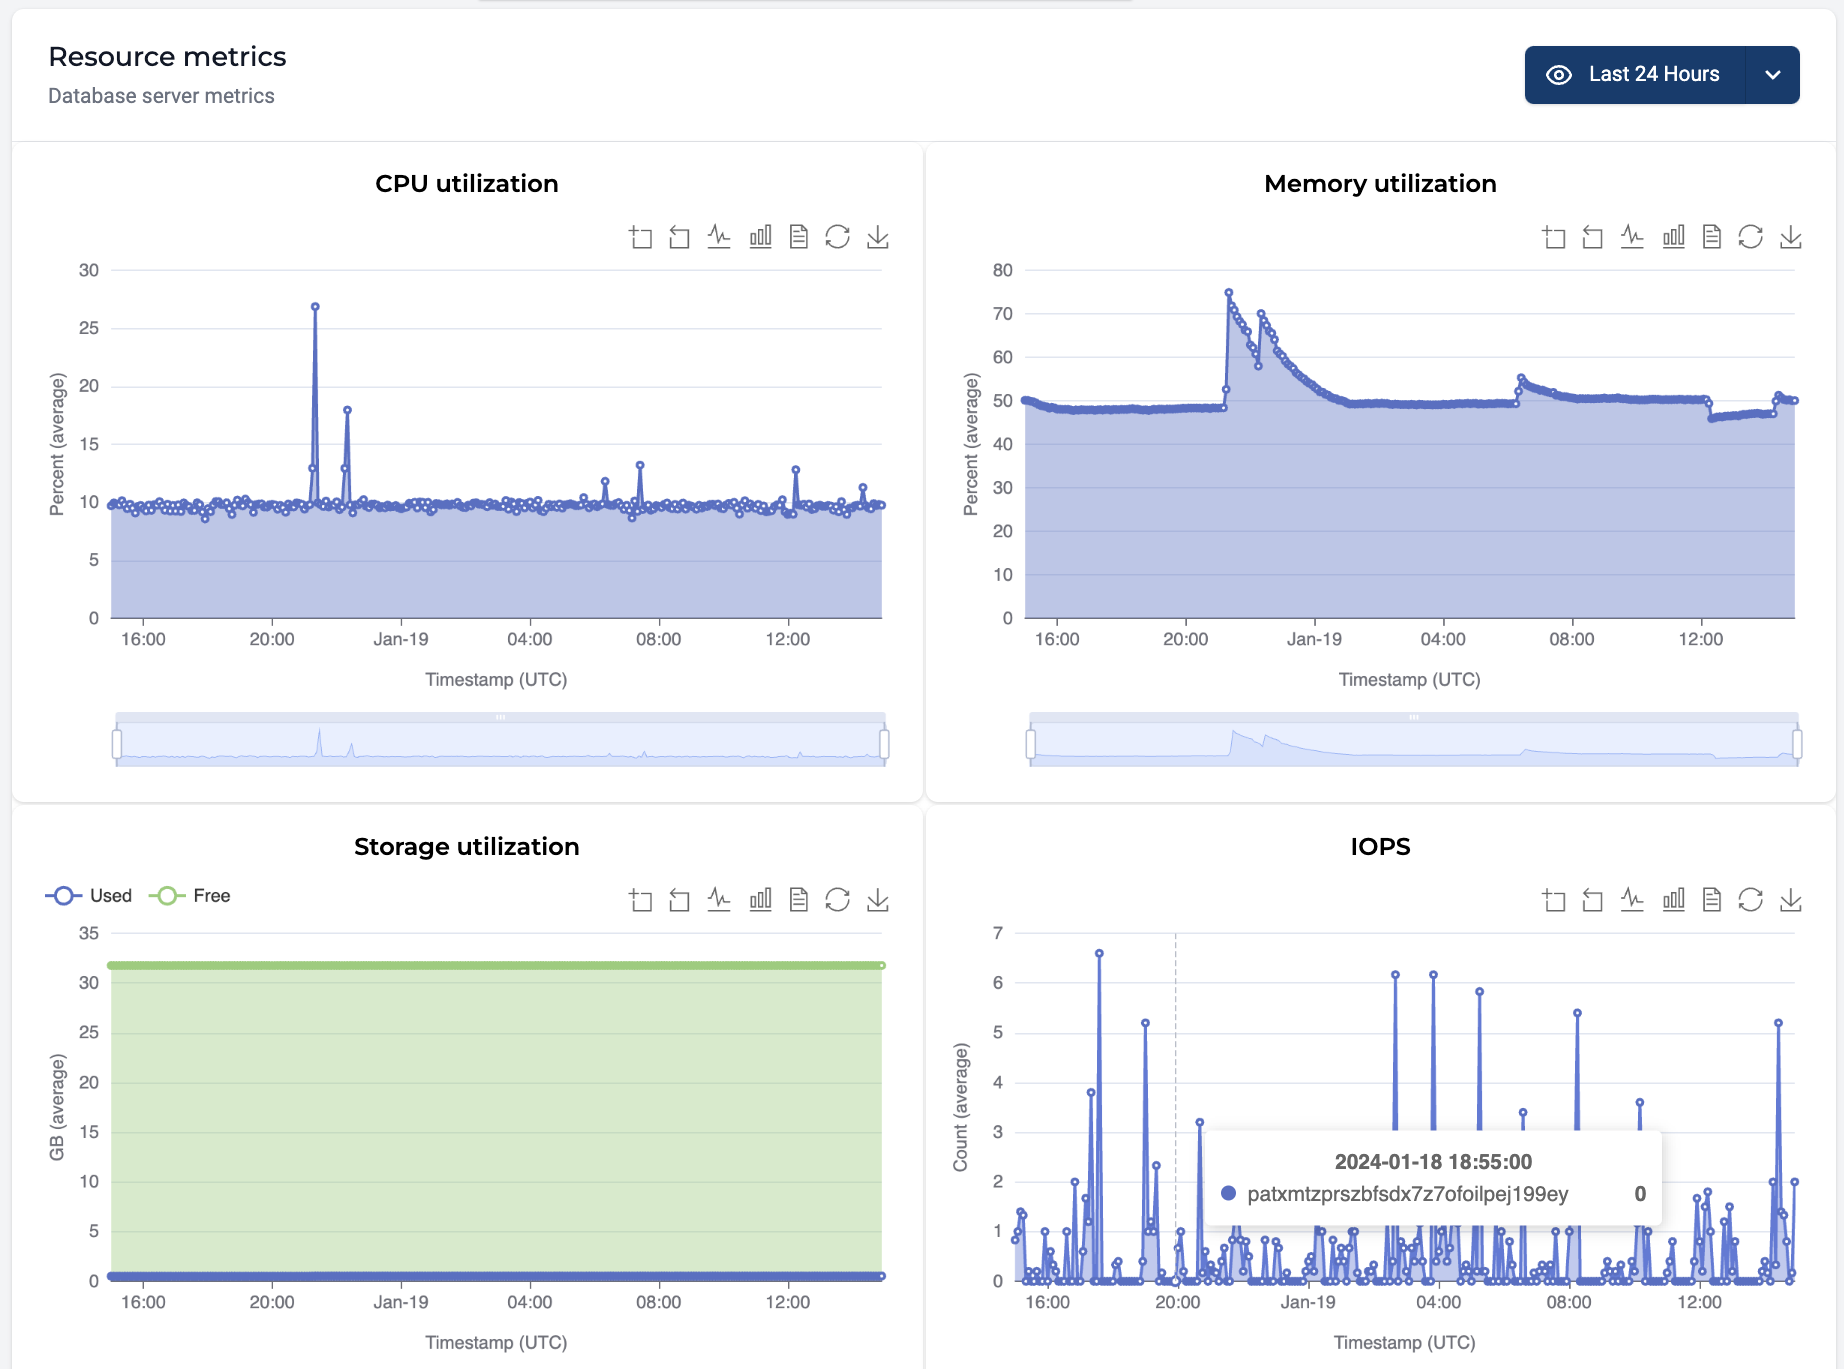
Included metrics:
- CPU utilization (percentage)
- Memory utilization (percentage)
- Storage utilization and free storage (gigabytes)
- IOPS (count)
- Active connections (count)
- Network I/O (mbps)
Metrics can be queried over the following periods:
- 24 hours
- 72 hours
- 7 days
- 14 days
- 30 days
Storage metrics
Utilization metrics for storage accounts are currently not reported in MedStack Control.